Monday, December 28, 2015

Some experiments with double balanced mixers and GNURadio

Hi all,
This post is all about frequency mixing , specifically double balanced mixers using diodes or ring mixers , commonly used in communication circuits . The circuit diagram of a ring mixer is given below .
(Courtesy : Radio-electronics )
Schematic of a double balanced mixer. 
As you can see , this makes use of two transformers and a four diodes . For most of the HF work , switching diodes like 1N4148 suffice . However , for better performance Schottky diodes like 1N5711 can be made use of . For more information on the working of this mixer and construction aspects , I strongly recommend the excellent video by W2AEW on ring mixers given below . 


So what I wish to explain in this video is a set of experiments carried out using a double balanced mixer which I shall call DB mixer for convenience :) The test gear consists of a DDS VFO , a crystal Colpitts oscillator , a variable  power supply , CRO , RTL-SDR and the PC sound card . The software tools used are GQRX and GNURadio . Needless to say , the software run in Linux environment ( I use Linux Mint in my shack now ) .
A block diagram of the entire experiment is given below . 
Block Diagram 
The two RF signals are derived from the DDS VFO and a crystal oscillator . In this , we use a 27.000 MHz crystal from KDS . It is built into a Colpitts oscillator and an emitter follower is used to buffer the signal . It is then fed into the RF port of the mixer . The IF port is fed from the DDS with a 0.1 uF capacitor used to block the DC . No buffer or attenuator is used here , however using an attenuator is a good way to keep the VFO happy under a large variety of loads . The output from the mixer is given to various equipment as given above . However , the CRO and RTL-SDR are used alternatively as I use only a single BNC connection from the mixer . A connection from the mixer output goes to the line-in port ( the blue port ) of my PC soundcard . My PC is an old one ( 8+ years ), therefore it has a line-in port ! The connection is a direct one using shielded cable and only a potentiometer is used to reduce the signal level into the audio port . I know that this has the potential to raise eye brows as I have paid least attention to impedance matching and using proper cables . Let me once again emphasize that this is just a simple experiment and all that I'm interested is frequencies . The close-up shot of the circuit is given below .

The mixer and oscillator circuits 
Now let us turn out attention to the GNURadio  flowgraph that is used .The graph is given below.


The flowgraph is a simple and straightforward one . The input source is taken as an audio source block . The input is chosen as line-in the Linux audio settings . The number of inputs is set to two , for stereo input , even though I use only one channel . The float output of this block is converted into complex form using a float to complex block . The output of this block is then given to a low-pass filter with decimation . The decimation is set as a variable to change the decimation . Why ? Because if I need to observe a phenomena which has frequency change of the order of a few hertz , I change set the set the cut off frequency low , use high decimation and apply FFT on it . If the phenomena that I need to observe is a one with frequency changes of the order of a few kHz , I can set the cut-off frequency much higher , apply low decimation and use a similar FFT on the phenomena . If I needed to observe a few Hz case with higher number of samples , I may need to use a high point FFT and this can cause much load on the CPU and can clog the display . The result appears great with the current setup . The output from the LPF is given to a FFT sink as well as a Waterfall sink . The waterfall sink is disabled in the above flowgraph . 

Now let us start the real experiment. In the first experiment , we will use only the CRO and line-in port . The VFO frequency is set around 27 MHz , to be precise  27.011380 MHz in our case . Let me remind you that the VFO is not a calibrated one . Even though it has a precision of 1Hz , it is not accurate . That said , the frequency is close to the frequency of oscillation of the oscillator that we are using . 

So what will you obtain at the output ? The sum and difference , of course with a sea of harmonics  ! The sum is around 54 Mhz and we are not currently interested in it . The real fun lies in the difference signal , which is now set to below 100 Hz by tweaking the VFO frequency . A word of caution , the frequency of this signal can change rapidly due to power supply variations as well as stray capacitance and other nasty reasons . Therefore I won't say that it is precisely so and so . Only a rough value can be given now :D . 
Now let us turn our attention to the output seen on the CRO . The timebase is set to a few ms (5 ms to 100 ms) , which can be changed as you wish :P . As can be seen now , the output has many components , the low frequency variation can be seen clearly in the two pictures below . Now why do you see only a portion of the waveform ? It is due to the exposure time of the camera that I use . 


The next fun is with the GNURadio plots . Remember the FFT plots in the flowgraph ? Here are the plots . You can see two spikes in the output . Only one is the true one . The other one appears because I don't use quadrature sampling as an image . Neglect it .


In the following plot , the frequency has changed as I changed the VFO output by a few Hz ( roughly 10Hz )  . The change in the spectrum can be seen clearly . It is for this utility that decimation is done in the LPF section .


The next display is with the FFT as well as waterfall plots in the same window . This is by enabling the waterfall block in the flowgraph . Long term frequency variations can be seen in waterfall plots . However , this can have a lot of sources , including drift in the Xtal oscillator , drift in VFO , and clock variations in the soundcard . 


Monday, August 24, 2015

The trouble with double balanced mixers

Hello folks !
I never knew that overdriving double balanced mixers can actually reduce their very purpose of carrier suppression . I found this out while watching a video on microwave mixers . This problem was plaguing my Bitx40 , one of the reasons why I didn't put a linear stage on it and come on air . Instead of using its own LC VFO , I use a DDS VFO external to the Bitx40 . It had stupendous amount of carrier in its output . Trying to figure out the cause , I changed the diodes , rewound the transformers , but nothing worked out . However reducing the drive level alleviated the problem . After doing a few simulations of this in TINA-TI and obtaining the results , I did the same with the actual Bitx40 PCB . The CRO output looks much better now compared to the previous cases . The tests on a receiver too is encouraging as I can hear my sound as an SSB signal in it . Needless to say , the BFO stage has to be tuned to match the crystal filter's range to ensure best operation . If everything goes well , I will attach a IRF510 linear and come on air soon !

73s 

Sunday, July 19, 2015

Receiving NOAA weather images using RTL-SDR

HI all ,
In one of my previous posts , I explained how to receive ISS SSTV images (see RECEIVING SSTV FROM ISS ! Steps involved in decoding when using MMSSTV ).Today I will describe reception of APT images from NOAA series of satellites using RTL-SDR dongles . The steps are outlined below .

  1. Record the WBFM signals from one of the NOAA weather sats ( NOAA 15,18 or 19) . You can use any of the satellite prediction software like Orbitron,GPredict etc to do the predictions . The recording can be done using any the SDR software like SDRsharp , HDSDR or GQRX . I use GQRX as my lab PC is Linux powered (see Lab / Shack PC running Linux ! ) . The recording should be in .WAV format with the filter set tot the right bandwidth .
  2. Import the .WAV file into Audacity . Change the project rate to 11025 Hz and split the stereo track into two ( If u don't know audacity , this can be done by clicking the small arrow button near the tracks ) . Delete one of the tracks and make the other track mono .
  3. Export the file into .WAV format 
  4. Open APTdecoder which is a nice and simple software to decode APT images . Click the folder icon to open the OPEN dialogue box . Navigate to the folder where you have kept the new .WAV file and open it .
  5. You will now see the image appearing on the seen . Bravo ! You have done it !
  6. Further , you can rotate the image , enhance it , equalize it , and create false color images by combining the A and B tracks .
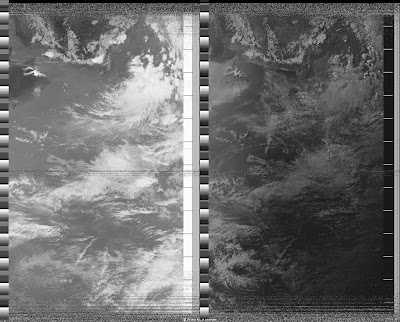
Here is an image that I decoded today (July 19 , 2015) evening at ~17.42 IST . The satellite was NOAA 18 with the antenna being a GP and cable RG-58 . It was a westerly pass and was the best , considering my antenna location .  It would be much better to use antennas like turnstile antenna .
A & B channels 

False colored image
73s !
DE VU3VWB 

Thursday, June 25, 2015

Jottings on HEXFET power amplifiers

Hi all,
HEXFETs are quite popular with hams as HF linear stages . I too attempted to make some linear amps with them and that too with pretty promising results . Here is the outcome . The first FET that I tried was a IRF540 . The circuit used is given below .
I had to place some component in TINA as a choke , so I put a 1m choke . In reality , I used a torroid with some 20 winding . I could pull some 2~3W into a 50 ohm dummy load ( which I used as a termination in front of the CRO ) at 1MHz , but at higher freq , power output dropped drastically . The power calculation was carried on the basis of the voltage that I measured across 50 ohm load . The voltage peak to peak was 40V . So that gives me around 2W power . Next , I'm gonna try IRF530 , IRF610 etc  

Monday, June 22, 2015

Some thoughts on DDS VFOs


Hello all !
I recently homebrewed a Direct Digital Synthesis Variable Frequency Oscillator (DDS VFO) . The reason for this was quite strong.Almost all the VFOs that I had attempted suffered from stability issues.Besides,it was impossible to know the frequency of oscillation precisely and accurately (with atleast 100Hz precision).It was then I came to notice the AD9850 DDS modules in ebay.They are cheap,easy to use,stable and have a large tuning range (from ~1Hz to 40Mhz) which makes them a good alternative to analog VFOs.On another note,VU2MV,OM Venu once commented " You need the grace of God to make a stable analog VFO !".
The VFO design is simple.I use an Arduino as the controlling board. The frequency tuning is carried out using four push buttons,arranged in a navigation button style. The code for Arduino and the inside view of VFO shall be posted soon along with the ckt diagram. For the time being,I'm posting the pics of the completed VFO and the video of its smoke test :) . Thankfully no smoke appeared !
I frequently use this VFO to tune into the 40m morning nets . The output of this VFO can be mixed with the antenna input (using a ring modulator or a balanced modulator) to get the audio from SSB transmissions , using the direct conversion principle.

VFO display 

VFO testing
VFO smoke test video .

Sunday, April 19, 2015

Lab / Shack PC running Linux !

As I mentioned in my previous post , my shack PC was QRT due to a HDD failure . Even though I didn't replace its 160GB HDD , I can use it without much trouble , running Linux , Xubuntu to be precise . I installed Ubuntu 14.04 with Xubuntu desktop and now it works very well , even though it throws some errors here and there ! It is now armed with a variety of tools ( software) . The major software are

  1. GQRX :-a nice software for SDR operations , can be installed from terminal as " sudo apt-get install gqrx " or from software center
  2. Python :- for small programming exercises , can be installed from terminal as " sudo apt-get install python " or from software center
  3. rtl_power :- a powerful utility to make wideband spectrum observations with RTLSDR
  4. RTLSDR - scanner :- an extremely powerful tool for RF engineering , I downloaded it yesterday and am thinking of its possible uses , ranging from filter design to amplifier testing to radio astronomy . It can be downloaded from "https://github.com/EarToEarOak/RTLSDR-Scanner " as a zip file , change directory to src in the extracted file and run " python rtlsdr_scan.py" from the terminal 
  5. Arduino IDE :- you know what it is used for ! 
  6. GNOME Predict : A highly useful software to make satellite pass predictions .

I'm also going to install some circuit simulation tools like QUCS in the near future . And of course , Ubuntu terminal rocks !  

Sunday, February 1, 2015

RECEIVING SSTV FROM ISS ! Steps involved in decoding when using MMSSTV ......


A very interesting mode in ham radio is SSTV and more interesting is the SSTV from ISS - the International Space Station ! Receiving the images from ISS is pretty simple . However many hams have some problems recording SSTV audio and decoding them using MMSSTV . My ham friends like OM Ramesh VU3RGB , OM Sulaiman VU3SMQ and OM Dhanesh VU3DHN encouraged me to make a blog post describing the various steps involved .
1) The first step is simple . Just tune to 145.800MHz in your VHF receiver and record the audio using some device like your smartphone,holding it near to your rig .It is better to use SDRs like RTLSDR to record audio using a computer. However my shack PC is QRT now , so ,I can't use SDR . Anyway be sure to use some excellent satellite tracking software like the Hamsatdroid (Android) or Orbitron (Windows) to guide you in tracking the ISS .
2) After recording , copy the recorded .amr file to your PC from phone . Use some tool to convert the amr to wav file . One excellent online conversion tool is http://media.io/ .
3) Now download the .wav file and import it into audacity . Change the project rate to 11025 Hz and ensure that the audio is mono . Slice off the noise part and silence from the audio .
4) Now export it to another wav file . After this rename the new audio file with .mmv extension instead of .wav ( You may have to change folder settings for this )
5) Open MMSSTV software and set the mode to auto . Import the newly created .mmv file into it .
6) You will be able to view the image being decoded and shown ! Bravo ! You now have the image .Export it .

I have deliberately skipped certain steps which are obvious :)

Some of the pics that I obtained are given below .
Dec 20 , 2014


Feb 1 , 2015 , 19.05 IST
April 12 , 2015 


April 12 , 2015 , Partial image